| Summary: | ASTERISK-14896: [patch] Huge memory consumption after few hours of load | ||
| Reporter: | Atis Lezdins (atis) | Labels: | |
| Date Opened: | 2009-09-27 17:14:12 | Date Closed: | 2011-06-07 14:00:57 |
| Priority: | Major | Regression? | No |
| Status: | Closed/Complete | Components: | Core/General |
| Versions: | Frequency of Occurrence | ||
| Related Issues: | |||
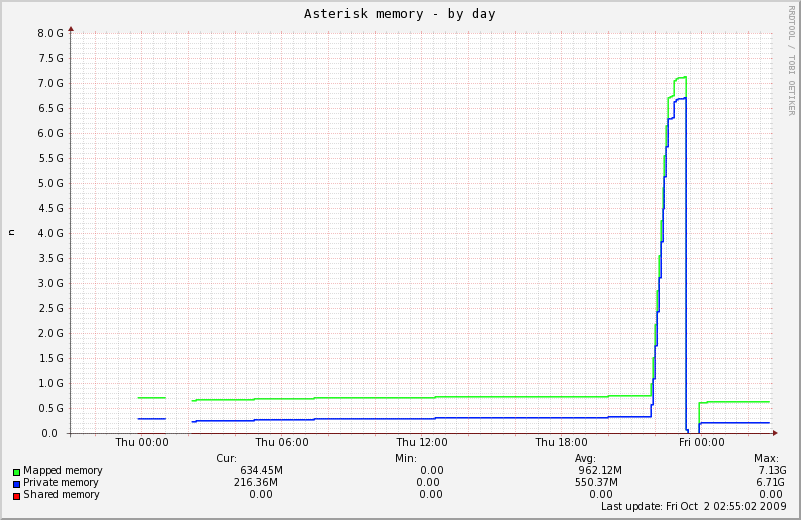
| Environment: | Attachments: | ( 0) asterisk_memory.txt.gz ( 1) localhost-asterisk_memory-day.png ( 2) locks.txt ( 3) logger_repeating.patch ( 4) valgrind_truncated.txt ( 5) valgrind.2.txt | |
| Description: | I'm doing load tests on Asterisk 1.6.1.5 and after few hours of load, it takes 80% of ram (6GB installed), so it becomes unable to fork itself (when using System() dialplan app), and creating core dump takes an hour. Core dumps are in size of 9 Gigabytes. Memory summary doesn't show anytingh of much usage: 80469516 bytes allocated (8800 in caches) in 71421 allocations while top shows: Mem: 6055876k total, 6009316k used, 46560k free, 19220k buffers Swap: 4096564k total, 4096548k used, 16k free, 249980k cached PID USER PR NI VIRT RES SHR S %CPU %MEM TIME+ COMMAND 15870 asterisk 10 -10 9780m 4.8g 3936 S 6 83.1 505:00.32 asterisk | ||
| Comments: | By: Sean Bright (seanbright) 2009-09-28 10:24:43 Could you provide the test harness you are using that is causing this to happen? By: Atis Lezdins (atis) 2009-09-28 10:29:43 Not really. I have bunch of realtime dialplans, queues, local channels, and I'm generating calls that do some random actions, send random DTMFs, do chanspy, log in and out to queue. This is actual simulation of production system, so it's huge and linked with lots of external stuff. I would like to find out some way how I can debug this, as "memory show summary"/"allocations" doesn't really show anything meaningless. By: Tilghman Lesher (tilghman) 2009-09-28 14:11:59 [13:43] <lmadsen> I'm not sure what to ask for there [13:45] <Corydon76-lap> I'm not sure that it's a bug in Asterisk [13:46] <Corydon76-lap> as I mentioned in #asterisk-dev over the weekend [13:46] <Corydon76-lap> Linux does NOT release memory allocated to the process back to the core until the process ends. Ever. [13:47] <Corydon76-lap> So if his massive load once took up 4.8GB of memory, then it's going to continue to take up that amount until the process dies [13:48] <Corydon76-lap> and there is ZERO that we can do to change that [13:48] <Corydon76-lap> only thing to fix it is to add more swap By: Atis Lezdins (atis) 2009-09-28 16:40:55 Well, the issue is why it takes so much memory, because 1.4 tree didn't ever used half of that amount under similar conditions. I can reproduce this quite often, having ~ 100 simultaneous channels, no transcoding, Monitor, Queue, and new call every 3-5 seconds. However, as i'm doing automated tests, it's not easy for me to detect exact call when this starts, currently i have hanging asterisk, taking 4g ram, eating whole cpu and not responding to any CLI commands. Would there be any way how to detect such massive memory allocations? Unfortunately there's no doc on memory debug inside doc/ dir. By: Atis Lezdins (atis) 2009-09-29 16:28:17 I have traced this to the following symptoms: 10:00:01.8290 - Asterisk is up for 1 hour, 45 minutes, 14 seconds, ~ 120 concurrent channels, memory footprint from `pmap -d` is: mapped: 875912K writeable/private: 199812K shared: 0K 10:50:01.8108 - normal activity, full log grows with 6MB/min, Memory footprint is the same: mapped: 878420K writeable/private: 202916K shared: 0K 10:50:03.3973 - log file starts to grow 250MB/min, with the following messages: [2009-09-29 10:50:03.3933] DEBUG[4110] app_queue.c: It's not our turn (SIP/inbound-test-80-02407420). [2009-09-29 10:50:03.3966] VERBOSE[20463] asterisk.c: -- Remote UNIX connection [2009-09-29 10:50:03.3972] DEBUG[5676] channel.c: Avoiding deadlock for channel '0x2bee2d8' [2009-09-29 10:50:03.3973] DEBUG[5676] channel.c: Avoiding deadlock for channel '0x2bee2d8' [2009-09-29 10:50:03.3974] DEBUG[5676] channel.c: Avoiding deadlock for channel '0x2bee2d8' [2009-09-29 10:50:03.3974] DEBUG[5676] channel.c: Avoiding deadlock for channel '0x2bee2d8' [2009-09-29 10:50:03.3974] DEBUG[5676] channel.c: Avoiding deadlock for channel '0x2bee2d8' [2009-09-29 10:50:03.3974] DEBUG[5676] channel.c: Avoiding deadlock for channel '0x2bee2d8' [2009-09-29 10:50:03.3975] DEBUG[5676] channel.c: Avoiding deadlock for channel '0x2bee2d8' ...snip... [2009-09-29 10:50:03.4028] DEBUG[5676] channel.c: Avoiding deadlock for channel '0x2bee2d8' [2009-09-29 10:50:03.4028] DEBUG[5676] channel.c: Failure, could not lock '0x2bee2d8' after 199 retries! [2009-09-29 10:50:03.4028] DEBUG[5676] channel.c: Avoiding deadlock for channel '0x2bee2d8' ...snip... [2009-09-29 10:50:46.9004] DEBUG[5676] channel.c: Avoiding deadlock for channel '0x2bee2d8' [2009-09-29 10:50:46.9004] DEBUG[6023] res_timing_pthread.c: Reading not available on timing pipe, quantity: 1 [2009-09-29 10:50:46.9004] DEBUG[5676] channel.c: Avoiding deadlock for channel '0x2bee2d8' ...snip... [2009-09-29 10:50:47.9225] DEBUG[5676] channel.c: Avoiding deadlock for channel '0x2bee2d8' [2009-09-29 10:50:47.9226] DEBUG[6023] res_timing_pthread.c: Reading not available on timing pipe, quantity: 1 [2009-09-29 10:50:47.9225] DEBUG[5676] channel.c: Avoiding deadlock for channel '0x2bee2d8' [2009-09-29 10:50:47.9227] DEBUG[6023] res_timing_pthread.c: Reading not available on timing pipe, quantity: 1 [2009-09-29 10:50:47.9227] DEBUG[6023] res_timing_pthread.c: Reading not available on timing pipe, quantity: 1 [2009-09-29 10:50:47.9228] DEBUG[6023] res_timing_pthread.c: Reading not available on timing pipe, quantity: 1 [2009-09-29 10:50:47.9228] DEBUG[5676] channel.c: Avoiding deadlock for channel '0x2bee2d8' [2009-09-29 10:50:47.9228] DEBUG[5676] channel.c: Avoiding deadlock for channel '0x2bee2d8' [2009-09-29 10:50:47.9228] DEBUG[6023] res_timing_pthread.c: Reading not available on timing pipe, quantity: 1 [2009-09-29 10:50:47.9228] DEBUG[5676] channel.c: Avoiding deadlock for channel '0x2bee2d8' ... total: 2166295 lines of Avoiding deadlock 10831 lines of Failure, 199 retries 376843 lines of Reading not available Dialplan continues to exectue between those messages 2009-09-29 10:51:01.8585 - memory footprint is still similar: mapped: 878456K writeable/private: 202952K shared: 0K 10:52:02.7206 memory footprint starts increasing: mapped: 1032008K writeable/private: 395276K shared: 0K 10:52:17.4263 - last message in log: [2009-09-29 10:52:17.4263] DEBUG[6023] res_timing_pthread.c: Reading not available on timing pipe, quantity: 1 10:53:02.1428 - mapped: 1599880K writeable/private: 780584K shared: 0K 10:54:02.6238 - mapped: 1689752K writeable/private: 1024204K shared: 0K 10:55:02.6746 - mapped: 1841996K writeable/private: 1253628K shared: 0K 10:56:02.2236 - mapped: 2458796K writeable/private: 1610912K shared: 0K After this my script kills asterisk, but from previous tests it would continue to eat memory. Missing logging could be unrelated, as for previous cases I remember seeing some logging, however it was quite unusable, as i did lots of tests before on that machine. By: Atis Lezdins (atis) 2009-09-30 11:20:32 I managed to reproduce this memory usage under valgrind last night, however box died completely because it run out of swap before i could finish valgrind session. Attached incomplete valgrind log, with the following lines grepped out: Warning: invalid file descriptor Use --log-fd=<number> to select an alternative log fd WARNING: unhandled syscall: 126 Read the file README_MISSING_SYSCALL_OR_IOCTL You may be able to write your own handler By: Atis Lezdins (atis) 2009-10-01 19:37:39 I have reproduced memory usage under valgrind, and got leak summary (attached valgrind.2.txt), which shows most memory lost within: 4,220,212,480 bytes in 6,594,082 blocks are possibly lost in loss record 1,960 of 1,960 at 0x4A05E7C: malloc (vg_replace_malloc.c:195) by 0x43F882: __ast_alloc_region (astmm.c:114) by 0x43F81D: __ast_calloc (astmm.c:204) by 0x4C564F: ast_log (logger.c:1138) by 0x458F3C: channel_find_locked (channel.c:1233) by 0x459056: ast_channel_walk_locked (channel.c:1267) by 0x46D0C3: handle_chanlist (cli.c:685) by 0x470CD4: ast_cli_command (cli.c:1888) by 0x470F3F: ast_cli_command_multiple (cli.c:1921) by 0x4370FA: netconsole (asterisk.c:1039) by 0x541B12: dummy_start (utils.c:968) by 0x3A42A06406: start_thread (pthread_create.c:297) However this doesn't seem to be the issue I was experiencing initially, as I added periodic calls to "core show channels" only when debugging in valgrind to monitor calls status. By: Digium Subversion (svnbot) 2009-10-01 22:07:27 Repository: asterisk Revision: 221920 U trunk/main/logger.c ------------------------------------------------------------------------ r221920 | tilghman | 2009-10-01 22:07:26 -0500 (Thu, 01 Oct 2009) | 4 lines Initialize a variable that we check immediately upon startup. (closes issue ASTERISK-14896) Reported by: atis ------------------------------------------------------------------------ http://svn.digium.com/view/asterisk?view=rev&revision=221920 By: Digium Subversion (svnbot) 2009-10-01 22:08:21 Repository: asterisk Revision: 221921 _U branches/1.6.0/ U branches/1.6.0/main/logger.c ------------------------------------------------------------------------ r221921 | tilghman | 2009-10-01 22:08:21 -0500 (Thu, 01 Oct 2009) | 11 lines Merged revisions 221920 via svnmerge from https://origsvn.digium.com/svn/asterisk/trunk ........ r221920 | tilghman | 2009-10-01 22:04:34 -0500 (Thu, 01 Oct 2009) | 4 lines Initialize a variable that we check immediately upon startup. (closes issue ASTERISK-14896) Reported by: atis ........ ------------------------------------------------------------------------ http://svn.digium.com/view/asterisk?view=rev&revision=221921 By: Digium Subversion (svnbot) 2009-10-01 22:09:25 Repository: asterisk Revision: 221922 _U branches/1.6.1/ U branches/1.6.1/main/logger.c ------------------------------------------------------------------------ r221922 | tilghman | 2009-10-01 22:09:25 -0500 (Thu, 01 Oct 2009) | 11 lines Merged revisions 221920 via svnmerge from https://origsvn.digium.com/svn/asterisk/trunk ........ r221920 | tilghman | 2009-10-01 22:04:34 -0500 (Thu, 01 Oct 2009) | 4 lines Initialize a variable that we check immediately upon startup. (closes issue ASTERISK-14896) Reported by: atis ........ ------------------------------------------------------------------------ http://svn.digium.com/view/asterisk?view=rev&revision=221922 By: Digium Subversion (svnbot) 2009-10-01 22:09:34 Repository: asterisk Revision: 221923 _U branches/1.6.2/ U branches/1.6.2/main/logger.c ------------------------------------------------------------------------ r221923 | tilghman | 2009-10-01 22:09:34 -0500 (Thu, 01 Oct 2009) | 11 lines Merged revisions 221920 via svnmerge from https://origsvn.digium.com/svn/asterisk/trunk ........ r221920 | tilghman | 2009-10-01 22:04:34 -0500 (Thu, 01 Oct 2009) | 4 lines Initialize a variable that we check immediately upon startup. (closes issue ASTERISK-14896) Reported by: atis ........ ------------------------------------------------------------------------ http://svn.digium.com/view/asterisk?view=rev&revision=221923 By: Atis Lezdins (atis) 2009-10-03 12:29:38 After Tilghman's patch I tested r221969, and still huge memory usage, however this time I had responsive "memory show summary" and it showed that logger.c has still eaten most of memory. Apparently individual threads were posting log messages too fast for logger thread to process. I wrote a simple logger flood avoidance (patch attached), and since then i had no symptoms of memory leak. However, at some point asterisk stops accepting calls and just freezes. I'll attach "core show locks" output, but my deadlock-detecting script didn't found anything there. When trying to debug this freezing, i issued "core show channels" which lead to the following output in the log: [2009-10-03 20:13:04.0859] DEBUG[21962] channel.c: Avoiding initial deadlock for channel '0x2aaae0308328' [2009-10-03 20:13:04.0859] DEBUG[21962] channel.c: Avoiding initial deadlock for channel '0x2aaae0308328' [2009-10-03 20:13:04.0859] DEBUG[21962] channel.c: Avoiding initial deadlock for channel '0x2aaae0308328' [2009-10-03 20:13:04.0859] DEBUG[21962] channel.c: Avoiding initial deadlock for channel '0x2aaae0308328' [2009-10-03 20:13:04.0859] DEBUG[21962] channel.c: Avoiding initial deadlock for channel '0x2aaae0308328' [2009-10-03 20:13:04.0859] DEBUG[21962] channel.c: Avoiding initial deadlock for channel '0x2aaae0308328' [2009-10-03 20:13:04.0870] DEBUG[21962] channel.c: Message repeats 194 times [2009-10-03 20:13:04.0870] DEBUG[21962] channel.c: Failure, could not lock '0x2aaae0308328' after 199 retries! However this time, asterisk actually stays alive. I guess Tilghman is right that accessing channel list is the cause for this deadlock avoidance, however I now have freezing asterisk without single usage of "core show channels". By: Atis Lezdins (atis) 2009-10-04 10:46:44 It seems that by removing res_timing_pthread (I also have res_timing_dahdi) I can achieve 7 hours uptime with parallel 130 channels, and memory usage less than 1.3GB Apparently last output of "core show locks" means that res_timing_pthread locks and keeps some lock that's essential for the rest of operations. By: Leif Madsen (lmadsen) 2010-07-21 12:21:09 Please test the latest branches after revision 278465 as res_timing_pthread has likely been fixed. http://svn.digium.com/view/asterisk?view=rev&revision=278465 By: Paul Belanger (pabelanger) 2010-08-04 11:57:22 Suspended due to lack of activity. Please request a bug marshal in #asterisk-bugs on the IRC network irc.freenode.net to reopen the issue should you have the additional information requested. Further information can be found at http://www.asterisk.org/developers/bug-guidelines | ||