| Summary: | ASTERISK-13971: Asterisk 1.4.24.1 deadlock | ||
| Reporter: | David Brillert (aragon) | Labels: | |
| Date Opened: | 2009-04-16 16:12:01 | Date Closed: | 2009-05-14 16:44:11 |
| Priority: | Major | Regression? | Yes |
| Status: | Closed/Complete | Components: | Channels/chan_local |
| Versions: | Frequency of Occurrence | ||
| Related Issues: | |||
| Environment: | Attachments: | ( 0) bt_scrubbed.txt ( 1) coreshowlocks.txt ( 2) mysqlqps.png ( 3) valgrind.txt | |
| Description: | Asterisk locks randomly This is the first lock on this system since upgrading to 1.4.24.1 yesterday ======================================================================= === Currently Held Locks ============================================== ======================================================================= === === <file> <line num> <function> <lock name> <lock addr> (times locked) === === Thread ID: 3086154656 (do_devstate_changes started at [ 363] devicestate.c ast_device_state_engine_init()) === ---> Tried and failed to get Lock #0 (channel.c): MUTEX 1101 channel_find_locked &c->lock 0x9469908 (0) === ------------------------------------------------------------------- === === Thread ID: 19549088 (do_monitor started at [16693] chan_sip.c restart_monitor()) === ---> Lock #0 (chan_sip.c): MUTEX 16545 do_monitor &iflock 0x4eb92e0 (1) === ---> Waiting for Lock #1 (pbx.c): MUTEX 2158 ast_extension_state_del &(&hints)->lock 0x8166948 (1) === --- ---> Locked Here: pbx.c line 2194 (ast_add_hint) === ------------------------------------------------------------------- === === Thread ID: 30337952 (pbx_thread started at [ 2663] pbx.c ast_pbx_start()) === ---> Lock #0 (channel.c): MUTEX 2751 ast_write &chan->lock 0x9469908 (1) === ---> Lock #1 (chan_local.c): MUTEX 320 local_write &p->lock 0x9476338 (1) === ------------------------------------------------------------------- === === Thread ID: 30829472 (session_do started at [ 2475] manager.c accept_thread()) === ---> Lock #0 (manager.c): RDLOCK 2235 process_message &actionlock 0x8164460 (1) === ---> Lock #1 (pbx.c): MUTEX 4850 ast_add_extension2 &con->lock 0x95a6218 (1) === ---> Lock #2 (pbx.c): MUTEX 2194 ast_add_hint &(&hints)->lock 0x8166948 (1) === ---> Tried and failed to get Lock #3 (channel.c): MUTEX 1101 channel_find_locked &c->lock 0x9469908 (0) === ------------------------------------------------------------------- === === Thread ID: 25209760 (pbx_thread started at [ 2663] pbx.c ast_pbx_start()) === ---> Waiting for Lock #0 (chan_sip.c): MUTEX 4648 sip_alloc &iflock 0x4eb92e0 (1) === --- ---> Locked Here: chan_sip.c line 16545 (do_monitor) === ------------------------------------------------------------------- === === Thread ID: 64269216 (session_do started at [ 2475] manager.c accept_thread()) === ---> Lock #0 (manager.c): RDLOCK 2235 process_message &actionlock 0x8164460 (1) === ---> Tried and failed to get Lock #1 (channel.c): MUTEX 1101 channel_find_locked &c->lock 0x9469908 (0) === ------------------------------------------------------------------- === ======================================================================= | ||
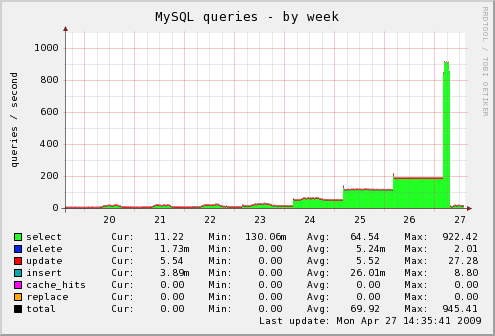
| Comments: | By: David Brillert (aragon) 2009-04-16 16:13:59 Connected to Asterisk 1.4.24.1 currently running on fireworx (pid = 11372) Verbosity is at least 3 Core debug is at least 3 By: Clod Patry (junky) 2009-04-18 07:39:42 Could you explain how you reproduce this scenario exactly? By: David Brillert (aragon) 2009-04-18 10:40:34 Hi Junky This was completely random and I have no idea how to reproduce. If it happens again do you have any advice to debug before I restart Asterisk? The core show locks looks like Asterisk locked because of some BLF monitoring/hints... There are two Snom phones with 7.3.14 firmware monitoring about 40 extensions and 4 parking orbits. During the lock the CLI was completely responsive and core show channels was also working normally but no calls could be made. By: Alan Graham (zerohalo) 2009-04-19 11:51:23 We also get this randomly - in this case, there were no active calls on the box. It does appear that some of the peers were going going from unreachable -> reachable at the time. 'core show locks' and backtrace attached. By: Michael Gaudette (bluefox) 2009-04-20 08:44:08 I get that too. There is no way from the CLI to know that anything is frozen, except for the lack of activity. All commands respond with (seemingly) appropriate data. Happened twice since I upgrade on the 17th of April 2009 (i.e. last 3 days). By: Michael Gaudette (bluefox) 2009-04-20 08:51:22 I just realized all my peers went UNREACHABLE just before the freeze.It's hard to say how long before, but those were the last messages in the CLI and the time seems to correspond to my customers calling angrily... By: Michael Gaudette (bluefox) 2009-04-20 10:44:55 Hopefully I am not spamming here, but one thing I noticed that may be linked to this is that, to prevent this sort of issue for the short-term, I changed qualify to 'no', and now all my peers are unmonitored and shown as such when I type "sip show peers". But I still get one peer being reachable and unreachable in the CLI...And I get that multiple times each time (about 4 or 5). This shoudn't happen if I understand correctly. By: Alan Graham (zerohalo) 2009-04-20 15:04:00 would this be related to the patch that file created some time ago to keep the peer hint status in memory so that BLF status wouldn't go to UNAVAILABLE upon restart? By: Michael Gaudette (bluefox) 2009-04-20 15:19:31 Well, it seems to eat more memory then mere hints would. My server usually hangs at around 30% memory used, I'm at 80% today (2GB on the PC, so that means I'm using about 1GB more than usual). I have about 400 hints active on the server. By: Alan Graham (zerohalo) 2009-04-20 16:40:05 Looking back at the machine's memory monitoring logs, I can confirm that memory usage spikes a bit right before the deadlock. Approximately 25-30% when normal usage is approx 12%. I'm guessing that maybe the queued state changes are using this increased memory. By: David Brillert (aragon) 2009-04-20 17:10:40 I tried to run Asterisk under Valgrind after business hours and capture about 1 hour of logs for possible memory problem. But Asterisk would not start under Valgrind Stops here res_indications.so => (Indications Resource) --10146:0:aspacem Valgrind: FATAL: aspacem assertion failed: --10146:0:aspacem aspacem_minAddr <= holeStart --10146:0:aspacem at m_aspacemgr/aspacemgr.c:1991 (vgPlain_am_get_advisory) --10146:0:aspacem Exiting now. By: David Brillert (aragon) 2009-04-20 19:17:08 After upgrading valgrind to 3.4.1 I was able to get some valgrind output attached output as valgrind.txt I rebooted some phones to test the unreachable theories posted above. I hope something useful is written to valgrind.txt The system was pretty idle at the time so I also made some remote test calls to some extension monitored by BLF. By: David Brillert (aragon) 2009-04-22 16:04:33 Asterisk just farted again, It just stopped receiving incoming calls (outgoing calls were working). core show locks did not display anything and no segfault Restarting asterisk was the only way to recover. No SIP unreachable messages in my messages log Just these events. [Apr 22 16:08:05] WARNING[1867] app_dial.c: Unable to create channel of type 'SIP' (cause 20 - Unknown) [Apr 22 16:08:05] WARNING[1873] app_dial.c: Unable to create channel of type 'SIP' (cause 20 - Unknown) [Apr 22 16:08:06] WARNING[1891] app_dial.c: Unable to create channel of type 'SIP' (cause 20 - Unknown) [Apr 22 16:08:06] WARNING[1903] app_dial.c: Unable to create channel of type 'SIP' (cause 20 - Unknown) [Apr 22 16:08:06] WARNING[1920] app_dial.c: Unable to create channel of type 'SIP' (cause 20 - Unknown) [Apr 22 16:08:06] WARNING[1946] app_dial.c: Unable to create channel of type 'SIP' (cause 20 - Unknown) [Apr 22 16:08:07] WARNING[1992] app_dial.c: Unable to create channel of type 'SIP' (cause 20 - Unknown) [Apr 22 16:08:07] WARNING[1998] app_dial.c: Unable to create channel of type 'SIP' (cause 20 - Unknown) [Apr 22 16:08:07] WARNING[2006] app_dial.c: Unable to create channel of type 'SIP' (cause 20 - Unknown) [Apr 22 16:08:07] WARNING[2010] app_dial.c: Unable to create channel of type 'SIP' (cause 20 - Unknown) [Apr 22 16:08:08] WARNING[2123] app_dial.c: Unable to create channel of type 'SIP' (cause 20 - Unknown) I attached valgrind.txt in previous post I can run * under valgrind again but only during after hours 9-6 PM EST By: David Brillert (aragon) 2009-04-23 07:56:10 During the last outage I was able to determine something. core show locks did not show any locks there was no segfault Outgoing calls were working Active calls were not dropped Incoming calls via PRI all failed to reach DNIS destination context correctly with this error (actual DNIS is scrubbed). -- Extension '5555' in context '' from '' does not exist. Rejecting call on channel 0/1, span 1 -- Extension '5556' in context '' from '' does not exist. Rejecting call on channel 0/1, span 1 PRI span was active Restarting Asterisk restored service on incoming lines. I also found these two lines in /var/spool/asterisk/mmlog WARNING: Low fence violation at 0xa049418, in action_command of manager.c, line 1715 WARNING: Low fence violation at 0xa3cd848, in action_command of manager.c, line 1716 I think the attached valgrind.txt must be helpful I did not check top for memory usage, but I think this must be memory corruption. Sorry but I have no idea how to read valgrind data and have no knowledge of C programming. By: Michael Gaudette (bluefox) 2009-04-23 11:18:14 I have had to revert to 1.4.23.2, but that last note might not be the same issue. I am 100% SIP and have seen what appeared to be the original issue, but obviously not that last one. By: Alan Graham (zerohalo) 2009-04-27 07:59:29 Had the exact same BT/core show locks - same scenario peers going from reachable -> unreachable. Logs show the same peers repeatedly going unreachable before lock: [Apr 27 04:03:24] NOTICE[24970] chan_sip.c: Peer 'PEERNAME' is now UNREACHABLE ! Last qualify: 72 [Apr 27 04:03:24] NOTICE[24970] chan_sip.c: Peer 'PEERNAME' is now UNREACHABLE ! Last qualify: 72 Outgoing registrations stopped functioning as well. By: Alan Graham (zerohalo) 2009-04-27 08:03:40 We're 100% SIP here as well - I do not get the last issue that aragon reported. By: David Brillert (aragon) 2009-04-27 08:08:20 I'd like an administrator to tell me what else is needed to move this ticket along? I am waiting for the next failure and would like to provide whatever information is needed to fix this when this happens (and it will). I thought valgrind data would be enough, what else is needed before an admin will look at this problem thoroughly or provide some feedback? What data is needed from the other reporters? By: David Brillert (aragon) 2009-04-27 10:29:12 This just happened on another site I maintain. This time it was the wake up call feature that stopped working and other types of calls and features were working. This is the first time I have seen the extensions become lagged. [Apr 27 11:23:44] NOTICE[4500]: utils.c:938 ast_carefulwrite: Timed out trying to write [Apr 27 11:23:44] NOTICE[11156]: chan_sip.c:12908 handle_response_peerpoke: Peer '451' is now Lagged. (3022ms / 2000ms) [Apr 27 11:23:44] NOTICE[11156]: chan_sip.c:12908 handle_response_peerpoke: Peer '407' is now Lagged. (3017ms / 2000ms) [Apr 27 11:23:44] NOTICE[11156]: chan_sip.c:12908 handle_response_peerpoke: Peer '401' is now Lagged. (3024ms / 2000ms) [Apr 27 11:23:44] NOTICE[4500]: utils.c:938 ast_carefulwrite: Timed out trying to write [Apr 27 11:23:44] NOTICE[11156]: chan_sip.c:12908 handle_response_peerpoke: Peer '160' is now Lagged. (3032ms / 2000ms) [Apr 27 11:23:44] NOTICE[11156]: chan_sip.c:12908 handle_response_peerpoke: Peer '140' is now Lagged. (3019ms / 2000ms) [Apr 27 11:23:44] NOTICE[11156]: chan_sip.c:12908 handle_response_peerpoke: Peer '207' is now Lagged. (3026ms / 2000ms) [Apr 27 11:23:45] NOTICE[11156]: chan_sip.c:12908 handle_response_peerpoke: Peer '260' is now Lagged. (3025ms / 2000ms) [Apr 27 11:23:45] NOTICE[11156]: chan_sip.c:12908 handle_response_peerpoke: Peer '239' is now Lagged. (3026ms / 2000ms) [Apr 27 11:23:45] NOTICE[11156]: chan_sip.c:12908 handle_response_peerpoke: Peer '237' is now Lagged. (3032ms / 2000ms) [Apr 27 11:23:45] NOTICE[11156]: chan_sip.c:12908 handle_response_peerpoke: Peer '229' is now Lagged. (3032ms / 2000ms) [Apr 27 11:23:45] NOTICE[4500]: utils.c:938 ast_carefulwrite: Timed out trying to write [Apr 27 11:23:45] NOTICE[11156]: chan_sip.c:12908 handle_response_peerpoke: Peer '312' is now Lagged. (3052ms / 2000ms) [Apr 27 11:23:45] NOTICE[11156]: chan_sip.c:12908 handle_response_peerpoke: Peer '329' is now Lagged. (3060ms / 2000ms) [Apr 27 11:23:45] NOTICE[4500]: utils.c:938 ast_carefulwrite: Timed out trying to write [Apr 27 11:23:45] NOTICE[4500]: utils.c:938 ast_carefulwrite: Timed out trying to write == Parsing '/etc/asterisk/manager.conf': Found gdb asterisk --pid='10627' [Thread debugging using libthread_db enabled] [New Thread -1208097088 (LWP 10627)] [New Thread 70917024 (LWP 29942)] [New Thread 62704544 (LWP 29941)] [New Thread 93797280 (LWP 29350)] [New Thread 38914976 (LWP 29349)] [New Thread 84618144 (LWP 29348)] [New Thread 78252960 (LWP 26588)] [New Thread 27429792 (LWP 21644)] [New Thread 28658592 (LWP 20427)] [New Thread 120368032 (LWP 19443)] [New Thread 88566688 (LWP 17265)] [New Thread 91339680 (LWP 4691)] [New Thread 26790816 (LWP 2059)] [New Thread 52251552 (LWP 16591)] [New Thread 28167072 (LWP 7162)] [New Thread 26299296 (LWP 7161)] [New Thread 124947360 (LWP 3214)] [New Thread 114707360 (LWP 2448)] [New Thread 100875168 (LWP 2446)] [New Thread 33110944 (LWP 29766)] [New Thread 31890336 (LWP 28870)] [New Thread 28412832 (LWP 28868)] [New Thread 72149920 (LWP 28867)] [New Thread 46726048 (LWP 28866)] [New Thread 109005728 (LWP 28865)] [New Thread 27675552 (LWP 14299)] [New Thread 27921312 (LWP 6329)] [New Thread 116427680 (LWP 16574)] [New Thread 86584224 (LWP 14035)] [New Thread 27184032 (LWP 13919)] [New Thread 26545056 (LWP 11580)] [New Thread 84945824 (LWP 11207)] [New Thread 61205408 (LWP 11206)] [New Thread 26028960 (LWP 11182)] [New Thread 112143264 (LWP 11156)] [New Thread 16280480 (LWP 10991)] [New Thread 15829920 (LWP 10990)] [New Thread 15354784 (LWP 10912)] [New Thread 14936992 (LWP 10911)] [New Thread 14666656 (LWP 10910)] [New Thread 14044064 (LWP 10909)] [New Thread 13613984 (LWP 10908)] [New Thread 12987296 (LWP 10907)] [New Thread 11316128 (LWP 10906)] [New Thread 10288032 (LWP 10905)] [New Thread 7805856 (LWP 10904)] [New Thread 7560096 (LWP 10903)] [New Thread 7314336 (LWP 10902)] [New Thread 7068576 (LWP 10901)] [New Thread 5155744 (LWP 10888)] [New Thread 4889504 (LWP 10887)] [New Thread 4545440 (LWP 10886)] [New Thread -1209095264 (LWP 10740)] [New Thread -1208849504 (LWP 10739)] [New Thread -1208603744 (LWP 10738)] [New Thread -1208357984 (LWP 10737)] [New Thread -1208099936 (LWP 10725)] Loaded symbols for /lib/libgcc_s.so.1 0x007737a2 in _dl_sysinfo_int80 () from /lib/ld-linux.so.2 (gdb) bt full #0 0x007737a2 in _dl_sysinfo_int80 () from /lib/ld-linux.so.2 No symbol table info available. #1 0x0094869b in __read_nocancel () from /lib/tls/libpthread.so.0 No symbol table info available. #2 0x0810ee91 in read_char () No symbol table info available. #3 0x0810ef32 in el_getc () No symbol table info available. #4 0x0810eda8 in read_getcmd () No symbol table info available. ASTERISK-1 0x0810f073 in el_gets () No symbol table info available. ASTERISK-2 0x08070a73 in main () No symbol table info available. By: David Brillert (aragon) 2009-04-27 10:43:01 I think these issues are all related to r165796 because they seem related to another ticket I opened http://bugs.digium.com/view.php?id=14843 Calls are controlled with AGI scripts zerohalo, bluefox; you also use AGI? When we reverted r165796 we were able to fix the symptoms of 14843 but never able to isolate root cause. On this site r165796 is not reverted. The unreachable status seem always to be prefixed with ast_carefulwrite timeouts. Now in this scenario I was able to capture some additional helpful information. -- Executing [s@customer-application-acd-reservations:9] BackGround("SIP/5555555555-b784f890", "all-reps-busy") in new stack -- <SIP/5555555555-b784f890> Playing 'all-reps-busy' (language 'en') [Apr 27 11:23:43] NOTICE[4359]: utils.c:938 ast_carefulwrite: Timed out trying to write [Apr 27 11:23:43] NOTICE[4359]: utils.c:938 ast_carefulwrite: Timed out trying to write [Apr 27 11:23:43] NOTICE[4359]: utils.c:938 ast_carefulwrite: Timed out trying to write [Apr 27 11:23:43] NOTICE[4359]: utils.c:938 ast_carefulwrite: Timed out trying to write [Apr 27 11:23:43] NOTICE[4359]: utils.c:938 ast_carefulwrite: Timed out trying to write [Apr 27 11:23:43] NOTICE[11156]: chan_sip.c:12908 handle_response_peerpoke: Peer '228' is now Lagged. (2018ms / 2000ms) [Apr 27 11:23:43] NOTICE[11156]: chan_sip.c:12908 handle_response_peerpoke: Peer '226' is now Lagged. (2017ms / 2000ms) [Apr 27 11:23:43] NOTICE[11156]: chan_sip.c:12908 handle_response_peerpoke: Peer '383' is now Lagged. (2021ms / 2000ms) [Apr 27 11:23:43] NOTICE[11156]: chan_sip.c:12908 handle_response_peerpoke: Peer '5192388060' is now Lagged. (2018ms / 2000ms) [Apr 27 11:23:43] NOTICE[11156]: chan_sip.c:12908 handle_response_peerpoke: Peer '428' is now Lagged. (2035ms / 2000ms) [Apr 27 11:23:43] NOTICE[11156]: chan_sip.c:12908 handle_response_peerpoke: Peer '422' is now Lagged. (2035ms / 2000ms) [Apr 27 11:23:43] NOTICE[11156]: chan_sip.c:12908 handle_response_peerpoke: Peer '421' is now Lagged. (2035ms / 2000ms) [Apr 27 11:23:43] NOTICE[11156]: chan_sip.c:12908 handle_response_peerpoke: Peer '333' is now Lagged. (2017ms / 2000ms) [Apr 27 11:23:43] NOTICE[4359]: utils.c:938 ast_carefulwrite: Timed out trying to write -- Executing [55555555555@customer-executive:1] Macro("SIP/383-b78fd600", "customer-dial-multi-629855") in new stack -- Executing [s@macro-customer-dial-multi-629855:1] AGI("SIP/383-b78fd600", "/var/www/scopserv/telephony/scripts/agi/extension.php") in new stack -- Launched AGI Script /var/www/scopserv/telephony/scripts/agi/extension.php [Apr 27 11:23:44] NOTICE[11156]: chan_sip.c:12908 handle_response_peerpoke: Peer '404' is now Lagged. (2115ms / 2000ms) [Apr 27 11:23:44] NOTICE[11156]: chan_sip.c:12908 handle_response_peerpoke: Peer '406' is now Lagged. (2117ms / 2000ms) [Apr 27 11:23:44] NOTICE[11156]: chan_sip.c:12908 handle_response_peerpoke: Peer '335' is now Lagged. (2149ms / 2000ms) [Apr 27 11:23:44] NOTICE[11156]: chan_sip.c:12908 handle_response_peerpoke: Peer '301' is now Lagged. (2147ms / 2000ms) [Apr 27 11:23:44] NOTICE[11156]: chan_sip.c:12908 handle_response_peerpoke: Peer '245' is now Lagged. (2147ms / 2000ms) [Apr 27 11:23:44] NOTICE[11156]: chan_sip.c:12908 handle_response_peerpoke: Peer '153' is now Lagged. (2147ms / 2000ms) [Apr 27 11:23:44] NOTICE[4359]: utils.c:938 ast_carefulwrite: Timed out trying to write [Apr 27 11:23:44] NOTICE[11156]: chan_sip.c:12908 handle_response_peerpoke: Peer '164' is now Lagged. (2150ms / 2000ms) [Apr 27 11:23:44] NOTICE[11156]: chan_sip.c:12908 handle_response_peerpoke: Peer '147' is now Lagged. (2165ms / 2000ms) [Apr 27 11:23:44] NOTICE[11156]: chan_sip.c:12908 handle_response_peerpoke: Peer '230' is now Lagged. (2135ms / 2000ms) [Apr 27 11:23:44] NOTICE[11156]: chan_sip.c:12908 handle_response_peerpoke: Peer '233' is now Lagged. (2135ms / 2000ms) By: Alan Graham (zerohalo) 2009-04-27 12:13:57 We do use AGI, but not relating in this situation. I believe the ast_carefulwrite may be a result of this deadlock issue, as we get this anytime an AGI executes on a dead/hungup channel. By: David Brillert (aragon) 2009-04-27 12:14:40 Found this in the /var/log/messages file I think this issue is related to http://bugs.digium.com/view.php?id=14723 [Apr 27 11:18:47] ERROR[14686] channel.c: ast_read() called with no recorded file descriptor. [Apr 27 11:18:47] ERROR[8852] channel.c: ast_read() called with no recorded file descriptor. [Apr 27 11:18:48] NOTICE[17166] utils.c: Timed out trying to write [Apr 27 11:18:48] NOTICE[17163] utils.c: Timed out trying to write [Apr 27 11:18:48] NOTICE[17166] utils.c: Timed out trying to write [Apr 27 11:18:48] NOTICE[17163] utils.c: Timed out trying to write [Apr 27 11:18:49] NOTICE[17166] utils.c: Timed out trying to write [Apr 27 11:18:49] NOTICE[17163] utils.c: Timed out trying to write [Apr 27 11:18:49] NOTICE[17166] utils.c: Timed out trying to write [Apr 27 11:18:49] NOTICE[17163] utils.c: Timed out trying to write [Apr 27 11:18:49] NOTICE[17166] utils.c: Timed out trying to write [Apr 27 11:18:49] NOTICE[17163] utils.c: Timed out trying to write [Apr 27 11:18:49] NOTICE[17166] utils.c: Timed out trying to write [Apr 27 11:18:49] NOTICE[17163] utils.c: Timed out trying to write [Apr 27 11:18:49] NOTICE[17166] utils.c: Timed out trying to write [Apr 27 11:18:49] NOTICE[17163] utils.c: Timed out trying to write [Apr 27 11:18:49] NOTICE[11156] chan_sip.c: Peer '123' is now Lagged. (2026ms / 2000ms) [Apr 27 11:18:49] NOTICE[11156] chan_sip.c: Peer '124' is now Lagged. (2033ms / 2000ms) [Apr 27 11:18:49] NOTICE[11156] chan_sip.c: Peer '125' is now Lagged. (2036ms / 2000ms) [Apr 27 11:18:49] NOTICE[11156] chan_sip.c: Peer '126' is now Lagged. (2035ms / 2000ms) [Apr 27 11:23:42] NOTICE[4352] chan_local.c: No such extension/context @customer-local while calling Local channel [Apr 27 11:23:42] NOTICE[4352] channel.c: Unable to call channel Local/@customer-local [Apr 27 11:23:42] NOTICE[4352] pbx_spool.c: Call failed to go through, reason (0) Call Failure (not BUSY, and not NO_ANSWER, maybe Circuit busy or down?) [Apr 27 11:23:42] NOTICE[4359] utils.c: Timed out trying to write Something is causing next line in dial plan not to be read by Asterisk and call hangs in limbo Events look exactly like 14723 I have high CPU loads but not 100% and CPU spikes randomly SIP peers going unreachable but not caused by network. I have not tested patch from 14723 zerhalo and bluefox are you able to test patch attached to 14723 and still reproduce same issue? These symptoms are exactly like http://bugs.digium.com/view.php?id=14843 But the application that fails is random. i.e. Sometimes incoming PRI fails Sometimes "wake up call" Sometimes outgoing calls Sometimes calls to IVR Sometimes calls to queues By: David Brillert (aragon) 2009-04-27 12:21:50 zerohalo, I only saw one lock resulting in my first bug report note. Subsequent failures have not resulted in any deadlock but next line in dial plan fails to execute. Reverting r165796 fixed incoming IVR failures related to agi in another of my tickets 14843. The problem with reverting r165796 for me is that it removed log notices that implied this problem was related to 14723. One of my unpatched (r165796 not reverted) sites reproduced the issues I see documented in 14723 so imho these issues must be related (at least to my ticket). I need to recompile Asterisk without reverting r165796 and with patch from 14723 to see if this fixes at least one site of mine. What happens if you test patch from 14723 ? By: Alan Graham (zerohalo) 2009-04-27 12:43:26 aragon- We may have distinctly different issues going on here. I think where this bug looked similar previously, it seems either different now, there is a cascade of different issues. I'll check out the patch this evening - this is a production server heavily loaded with hints and peers, so I will have to check this unloaded. I believe the hint/devstate change issue is long-standing and we're just now seeing it due to heavier load (I think I have seen it previously, but was unable to link it to anything). This morning's lock prevented peers from registering or new sip channels from being created. A little more detail: partial realtime, cached, 100% SIP very large dialplan, many hints, many peers (about 1000 each, normally) - load around 30 concurrent calls. This seems to manifest regardless of actual call load. By: Alan Graham (zerohalo) 2009-04-27 14:11:18 I think I may have found the source of the problem with our situation. It appears that we have been doing sip reloads daily from cron (when peers are 100% realtime). Monitoring mysql qps pointed me here, graph attached. When it reached critical mass, perhaps mysql couldn't reply in a timely manner, hence the dns lookup of the peername. By: Michael Gaudette (bluefox) 2009-04-30 08:20:54 Sorry, I missed the question above. No, I do NOT use any AGI. By: Leif Madsen (lmadsen) 2009-05-04 09:09:47 Tilghman: could you look at this issue and see if there is anything you can do to move it forward? This issue is blocking for the next release. Thanks! By: David Brillert (aragon) 2009-05-04 13:09:27 I haven't had the problem since my last report. If there is enough information in this bug already to move forward then please let me know. If there is insufficient information to move forward please tell me what else is needed the next time this occurs. Thank you By: Tilghman Lesher (tilghman) 2009-05-04 14:14:15 The fault on this is actually in chan_local, but there's been a change recently in the glare detection, which I believe to be related to this problem. So I'd like to know if anybody has this particular lockup after SVN 1.4 revision 190286. By: David Brillert (aragon) 2009-05-04 14:17:21 If this happens again soon I will test r190286 Anybody know when svn view will be back online? http://svn.digium.com/view/asterisk/branches/ By: Tilghman Lesher (tilghman) 2009-05-04 14:58:19 ViewVC is offline for the foreseeable future, due to abusive web spiders. By: Leif Madsen (lmadsen) 2009-05-05 10:32:37 I'm removing this from blocking for the next release because it is not reproducible. Once you can reproduce beyond the version Tilghman mentioned, then we can review this. By: Leif Madsen (lmadsen) 2009-05-05 10:45:01 I'm actually going to close this issue for now as 'unable to reproduce'. If you have the issue again, please do reopen this issue and attach the appropriate information. There is no point in leaving this open if it doesn't happen again. Thanks! By: David Brillert (aragon) 2009-05-05 10:55:51 This issue reproduced itself on three sites on the same version of Asterisk. One site experienced this issue three times Second site experienced this issue twice Third site occurred once I have reduced CPU loads on each site which minimizes exposure to the locks. I am waiting for the next lock to occur before trying an unofficial patch on all of these sites which may or may not fix this problem and may introduce other regressions. You are welcome to change the block version to 1.4.26 By: David Brillert (aragon) 2009-05-05 10:58:35 I will upgrade all sites to 1.4.25 once officially released to complete the testing and determine if this issue is fixed. By: Leif Madsen (lmadsen) 2009-05-05 13:04:31 OK, reopen the issue once 1.4.25 is released and you've reproduced the issue. Thanks! | ||